
")
(Base: January – December 2017 = 100)
- The Consumer Price Index (CPI) increased by 0.8 point or 0.7% from 112.3 in October 2021 to 113.1 in November 2021. The main contributors to the change in the index between October 2021 and November 2021 were:
| Commodity | Change in index point |
| Fruits | +0.3 |
| Vegetables | -0.1 |
| Meat | +0.1 |
| Other food products | +0.2 |
| Whisky | -0.1 |
| Washing materials and softners | +0.1 |
| Air tickets | +0.1 |
| Goods for personal care | +0.1 |
| Other goods and services | +0.1 |
| Total | +0.8 |
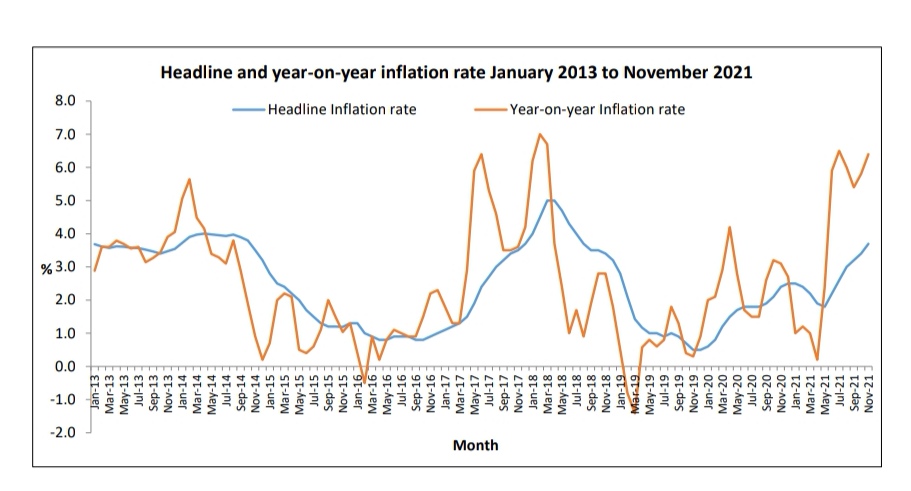
- Year-on-year (Y-o-y) inflation worked out to 6.4% in November 2021, compared to 3.1% in November 2020. Headline inflation for the 12-months ending November 2021 worked out to 3.7%, compared to 2.4% for the 12-months ending November 2020.
- Y-o-y CORE1 inflation stood at 5.0% in November 2021, compared to 2.6% in November 2020 while, y-o-y CORE2 inflation worked out to 5.2% in November 2021, compared to 3.6% in November 2020.
- CORE1 inflation for the 12-months ending November 2021 stood at 3.7%, compared to 1.6% in November 2020. Similarly, CORE2 inflation for the 12-months ending November 2021 worked out to 4.4%, compared to 2.8% in November 2020.
| Month | Consumer Price Index | Inflation Rate (%) | |||||
| Annual Average | Year-on-Year | ||||||
| Headline | CORE1 | CORE2 | Headline | CORE1 | CORE2 | ||
| November 2020 | 106.3 | 2.4 | 1.6 | 2.8 | 3.1 | 2.6 | 3.6 |
| October 2021 | 112.3 | 3.4 | 3.5 | 4.3 | 5.8 | 4.5 | 4.5 |
| November 2021 | 113.1 | 3.7 | 3.7 | 4.4 | 6.4 | 5.0 | 5.2 |
- Sub-indices for the twelve divisions of consumption expenditure for the month of November 2021 compared to October 2021 are shown below:
| Division | October 2021 | November 2021 | % change1 in index between October 2021 and November 2021 |
| 1. Food and non-alcoholic beverages | 118.3 | 120.4 | +1.8 |
| 2. Alcoholic beverages and tobacco | 118.4 | 118.0 | -0.4 |
| 3. Clothing and footwear | 110.2 | 110.2 | – |
| 4. Housing, water, electricity, gas and other fuels | 93.1 | 93.2 | – |
| 5. Furnishings, household equipment and routine household maintenance | 117.9 | 120.4 | +2.1 |
| 6. Health | 115.4 | 115.7 | +0.3 |
| 7. Transport | 113.8 | 114.6 | +0.7 |
| 8. Communication | 98.8 | 98.8 | – |
| 9. Recreation and culture | 110.9 | 111.5 | +0.5 |
| 10. Education | 111.1 | 111.1 | – |
| 11. Restaurants and hotels | 113.9 | 113.7 | -0.2 |
| 12. Miscellaneous goods and services | 112.8 | 113.9 | +0.9 |
| All Divisions | 112.3 | 113.1 | +0.7 |
| All Divisions, excluding “Alcoholic beverages and tobacco” | 111.5 | 112.5 | +0.9 |
1/ % change has been computed from unrounded indices and hence may vary slightly from the change in rounded indices.
Notes:
- The headline inflation rate is calculated by using the annual average method, that is, by comparing the average level of prices during a twelve-month period with the average level during the corresponding previous twelve-month period.
- The year-on-year inflation rate is calculated as the percentage change in the CPI for a given month with respect to the CPI for the corresponding month of the previous year.
- CORE1 excludes “Food, beverages and tobacco” components and mortgage interest on housing loan from headline inflation.
- CORE2 excludes Food, beverages and tobacco, mortgage interest on housing loan, electricity, gas, other fuels and items whose prices are controlled from headline inflation.
Detailed CPI series are available at the website of Statistics Mauritius:
Statistics > Statistics by Subject > Consumer Price Index
Source : Statistics Mauritius
Port Louis
07 December 2021